11.4 Rotation
In the PCA, the cross-loadings is very small, which means each variable loaded mostly on only one component.
irisNout <- principal(irisN,nfactors=2) # We just ran this earlier in the chapter
plot(irisNout)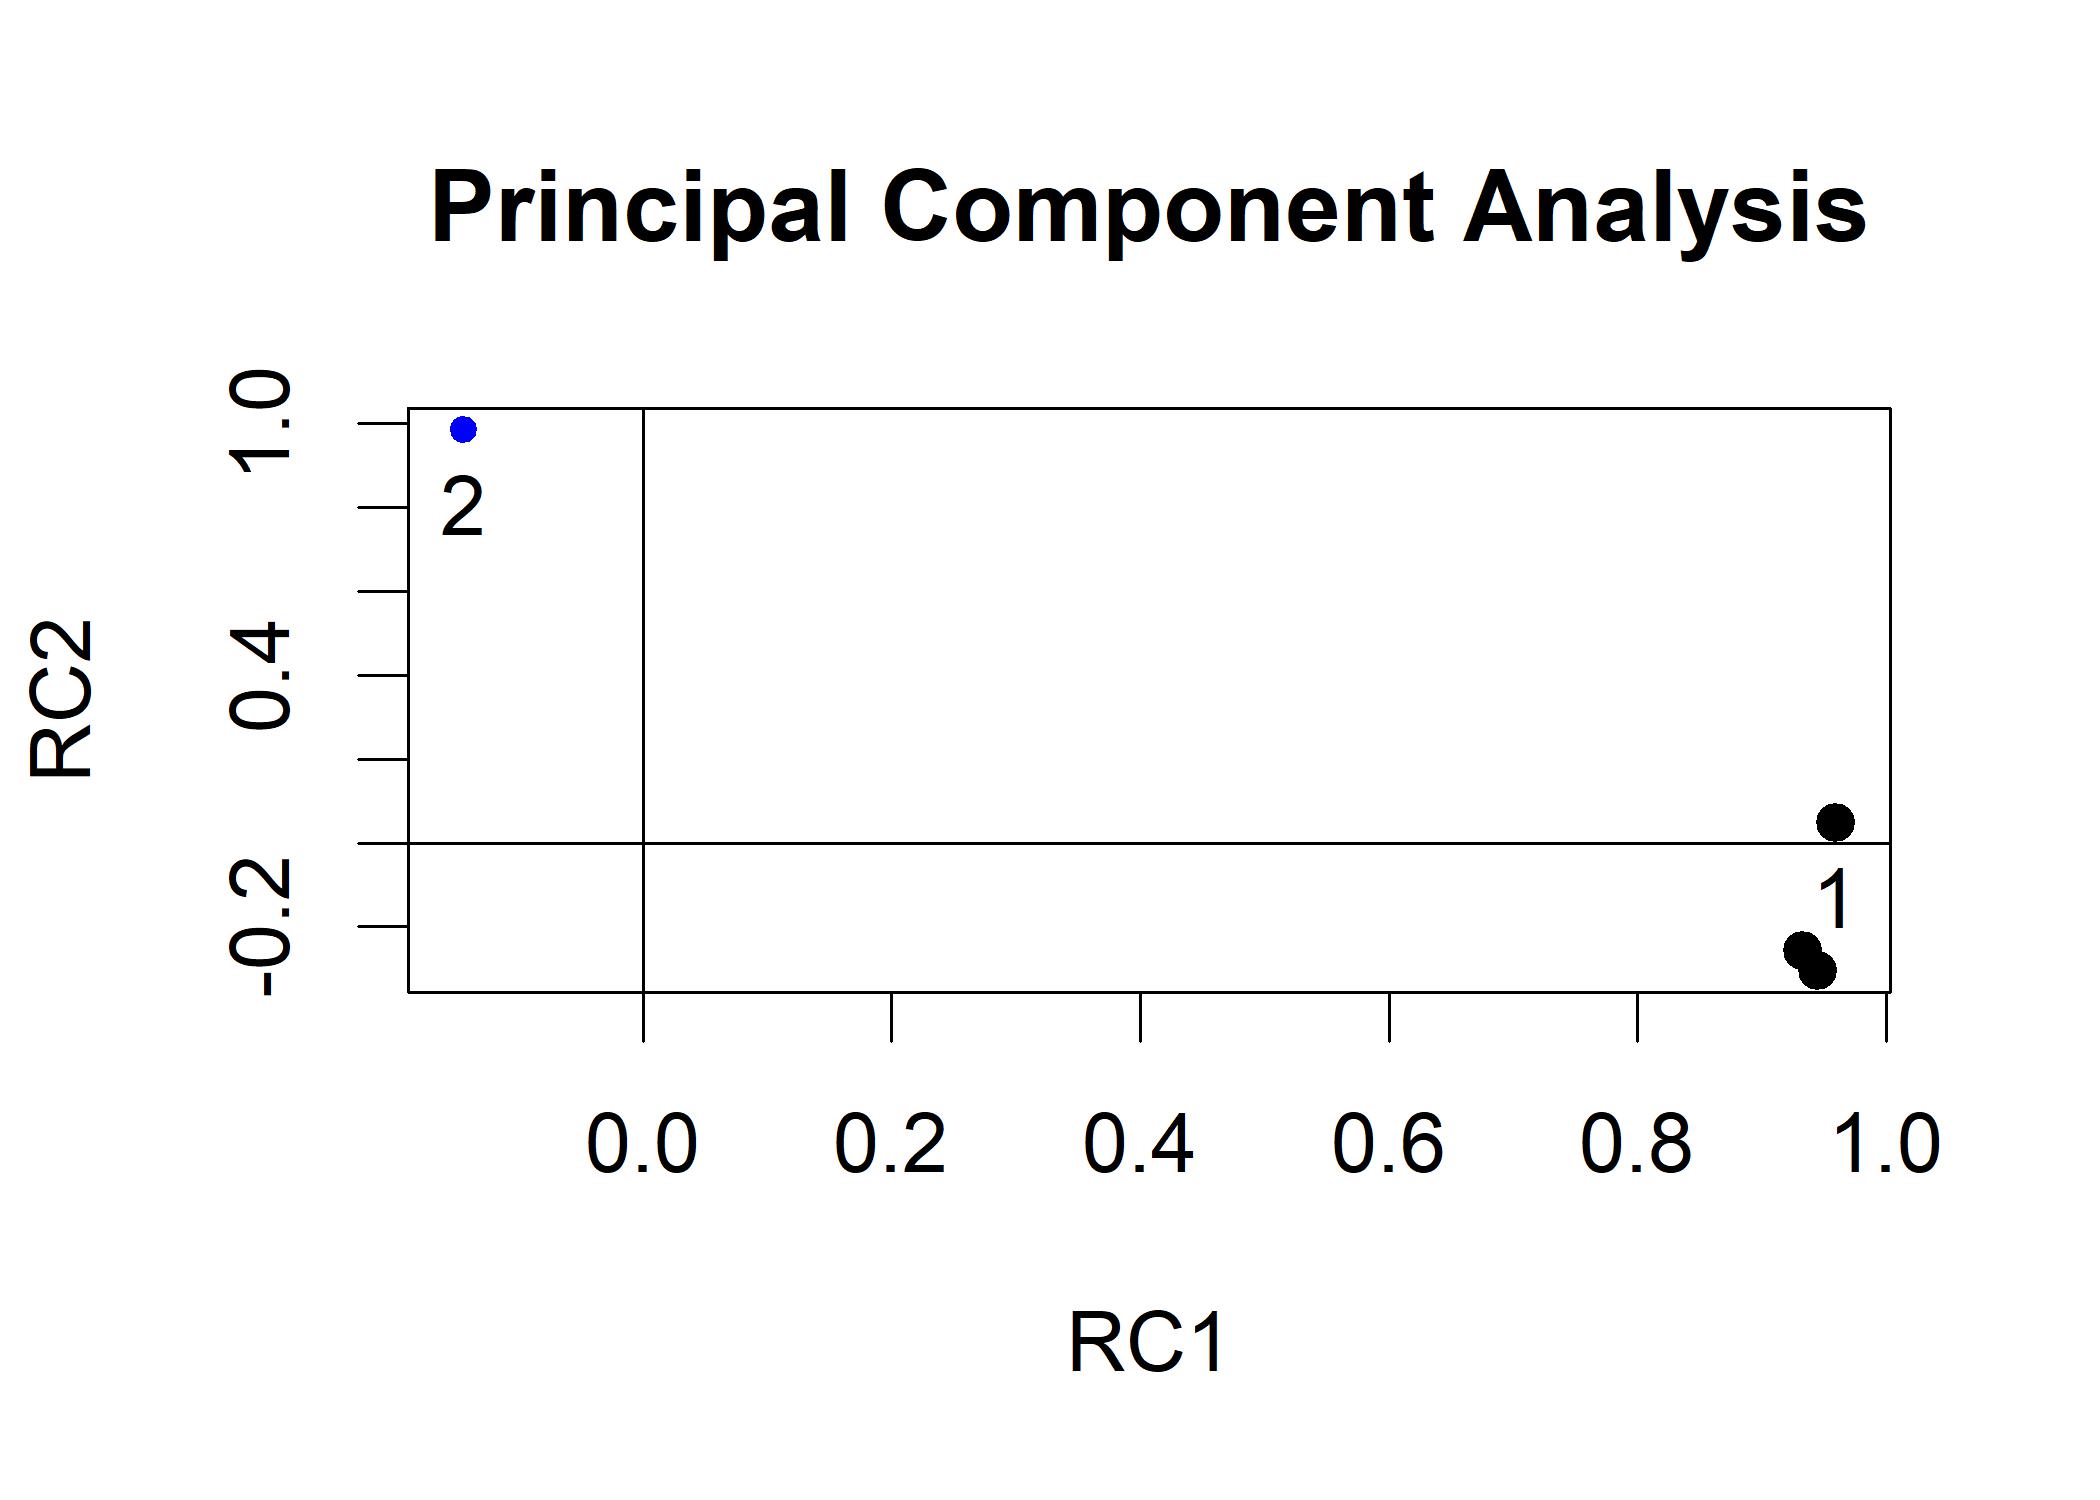 The plot shows the loading of each variable on the two components. The plot is easily interpreted because of low cross-loadings.
Now we use rotation to adjust the loadings to make them as interpretable as possible. The principal does a varimax rotation by default. Varimax rotates the axes for the loadings to maximize the variance of the squared loadings of all the items. Now let’s see the original coordinates look like.
irisNout <- principal(irisN,nfactors=2, rotate="none")
plot(irisNout)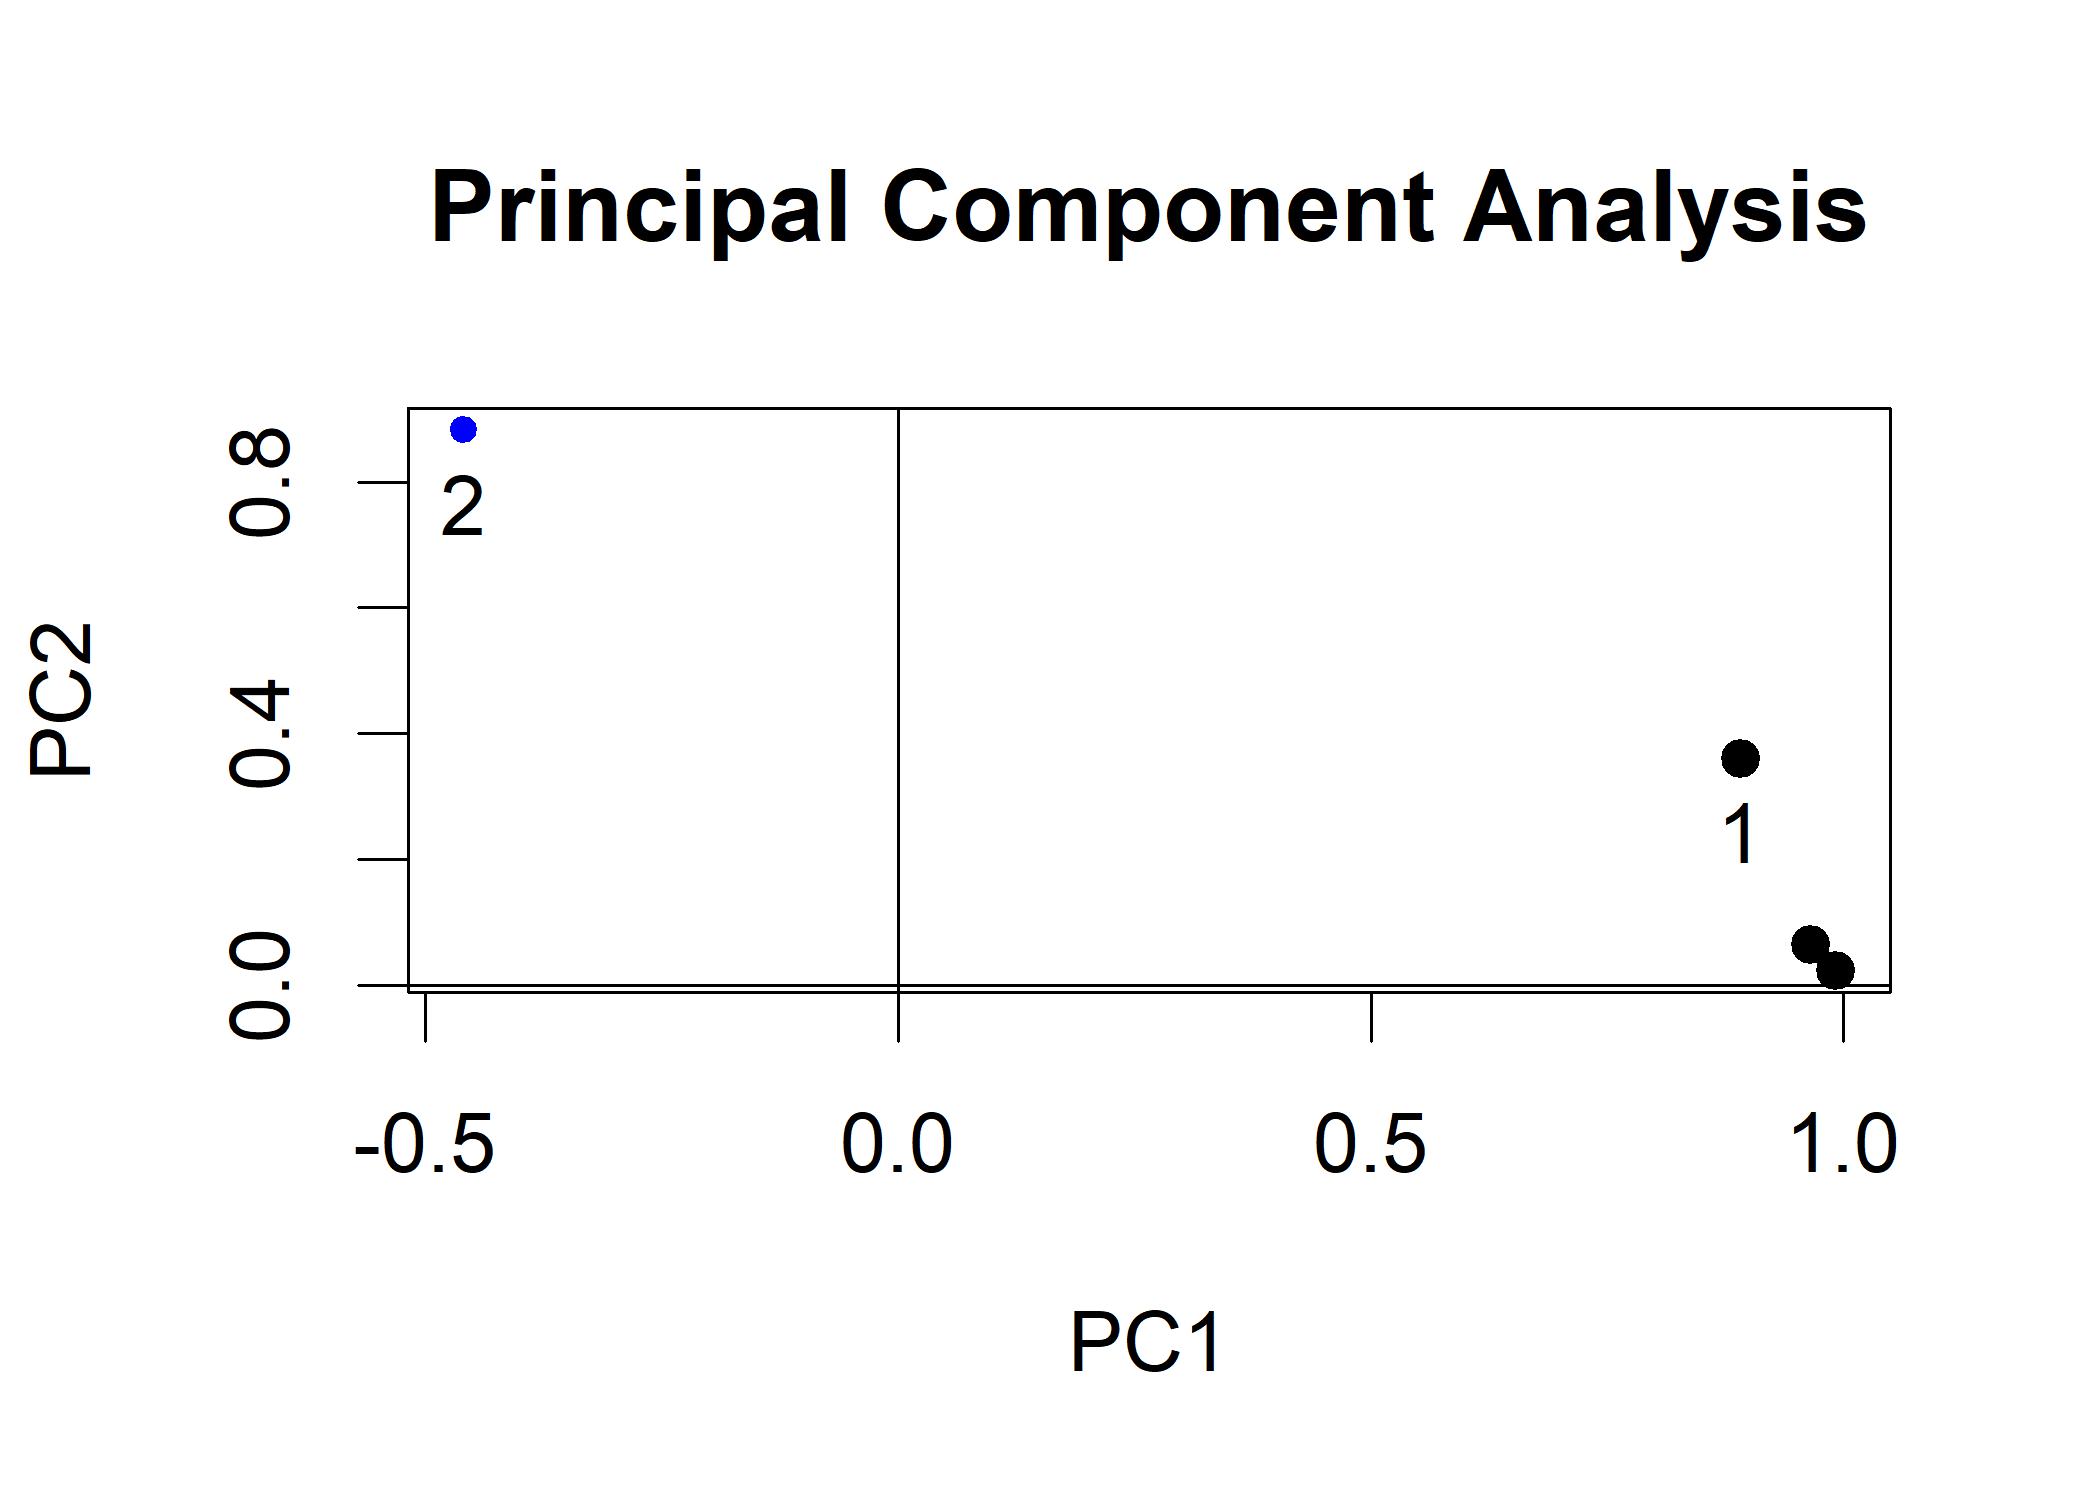 You can notice that the position of points do not fall near the axes. Item two loads at nearly -0.5 on PC1,
which is hard to interpret. Varimax is an “orthogonal” rotation, which means that the axes are always kept at right angles to one another.
You can notice that the position of points do not fall near the axes. Item two loads at nearly -0.5 on PC1,
which is hard to interpret. Varimax is an “orthogonal” rotation, which means that the axes are always kept at right angles to one another.