5.2 R illustration of Frequentist ANOVA
Let’s use the precip data that contains precipitation amounts from 70 U.S. cities in a roughly normal distribution to create three groups.
# Run ANOVA on groups sampled from the same population
set.seed(10)
# Enough for 3 groups of 20
precipAmount <- sample(precip, 60, replace=TRUE)
# Group desinators, 3 groups
precipGrp <- as.factor(rep(seq(from=1, to=3, by=1), 20))
precipDF <- data.frame(precipAmount, precipGrp)
# Get a box plot of the distribs
boxplot(precipAmount ~ precipGrp, data=precipDF)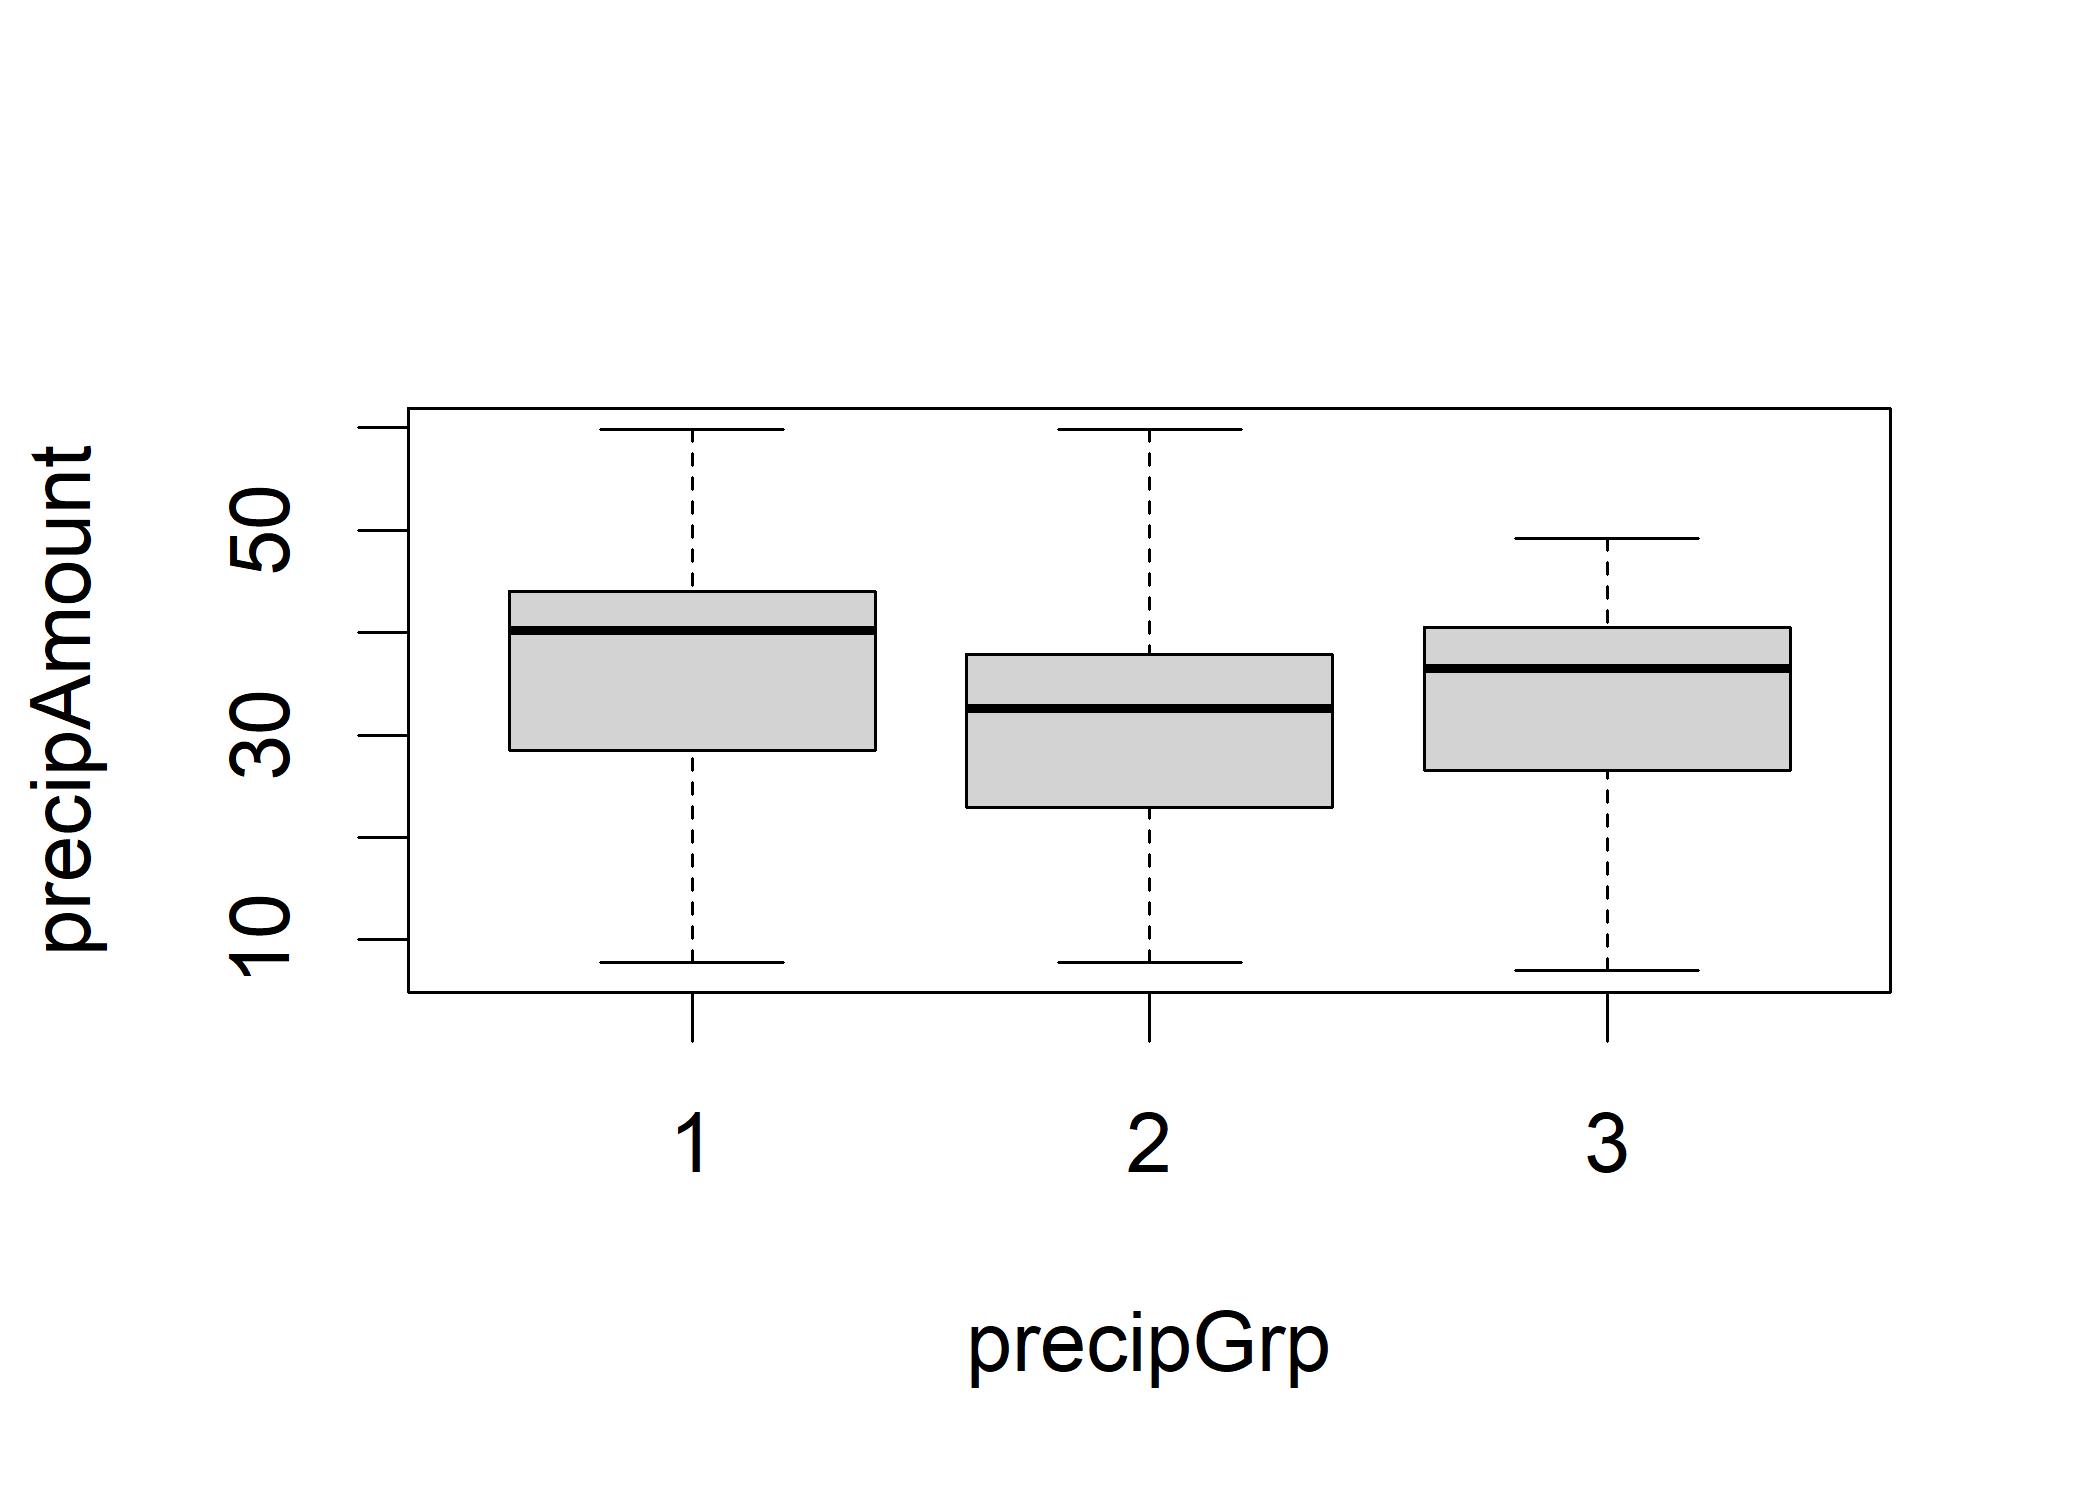
# Run the ANOVA
precipOut <- aov(precipAmount ~ precipGrp, data=precipDF)
summary(precipOut)  # Provide an ANOVA table
##             Df Sum Sq Mean Sq F value Pr(>F)
## precipGrp    2    352   176.2   0.995  0.376
## Residuals   57  10096   177.1
Interpretation
- DF: A statistical measure of how many components of a collection are subject to variation once a base set of statistics has been computed; One degree of freedom is lost from a set of 60 data points while calculating the grand mean; only two of the three group means can fluctuate freely, leaving 57 degrees of freedom within groups (aka. residuals).
- Sum Sq: the first line is the “between-groups” sum of squares; the second line is the “within- groups” sum of squares
- Mean Sq: variance, or sum of squares divided by degrees of freedom. The first line represents the variance “between groups,” and the second line represents the variance “within- groups.”
- F value: the ratio of the between-groups variance to the within-groups variance.
- Pr(>F): the probability of a larger F-ratio. This is the likelihood of obtaining an F-value at least this high in the random distribution of F-ratios for the degrees of freedom shown in this table. The smaller the probability, the more likely it is that the groups are from different populations.
- precipGrp: the independent variable.
- Residuals: accounts for all the within-groups variability, it is what is left over when all the systematic variance (precipGrp) is removed.
We anticipate that the between-groups variance (mean square) will be about equal to the within-groups variance when the data from all the groups is sampled from the same underlying population (mean square). The former is determined based on the variation in the raw data, whereas the latter is determined based on the spread of the means. F must be subtracted larger than one for ANOVA result to be statistically significant, and the Pr(>F) must be less than the alpha level to reject the null hypothesis, which is no different among groups.