1.10 F-value
The F-value is the ratio of the variance between the groups to the variance within the groups. The between-groups and within-groups degrees of freedom affect F’s exact shape. We plot three F distributions as follows:
fVals <- seq(from=0.01,to=5,by=0.01) # Make a sequential list of F values
# Plot the density function for this scenario
plot(fVals, df(fVals,df1=2,df2=57))
# Add points to the same plot, different df1
points(fVals, df(fVals,df1=3,df2=57))
# Add points to the same plot, different df1
points(fVals, df(fVals,df1=4,df2=57))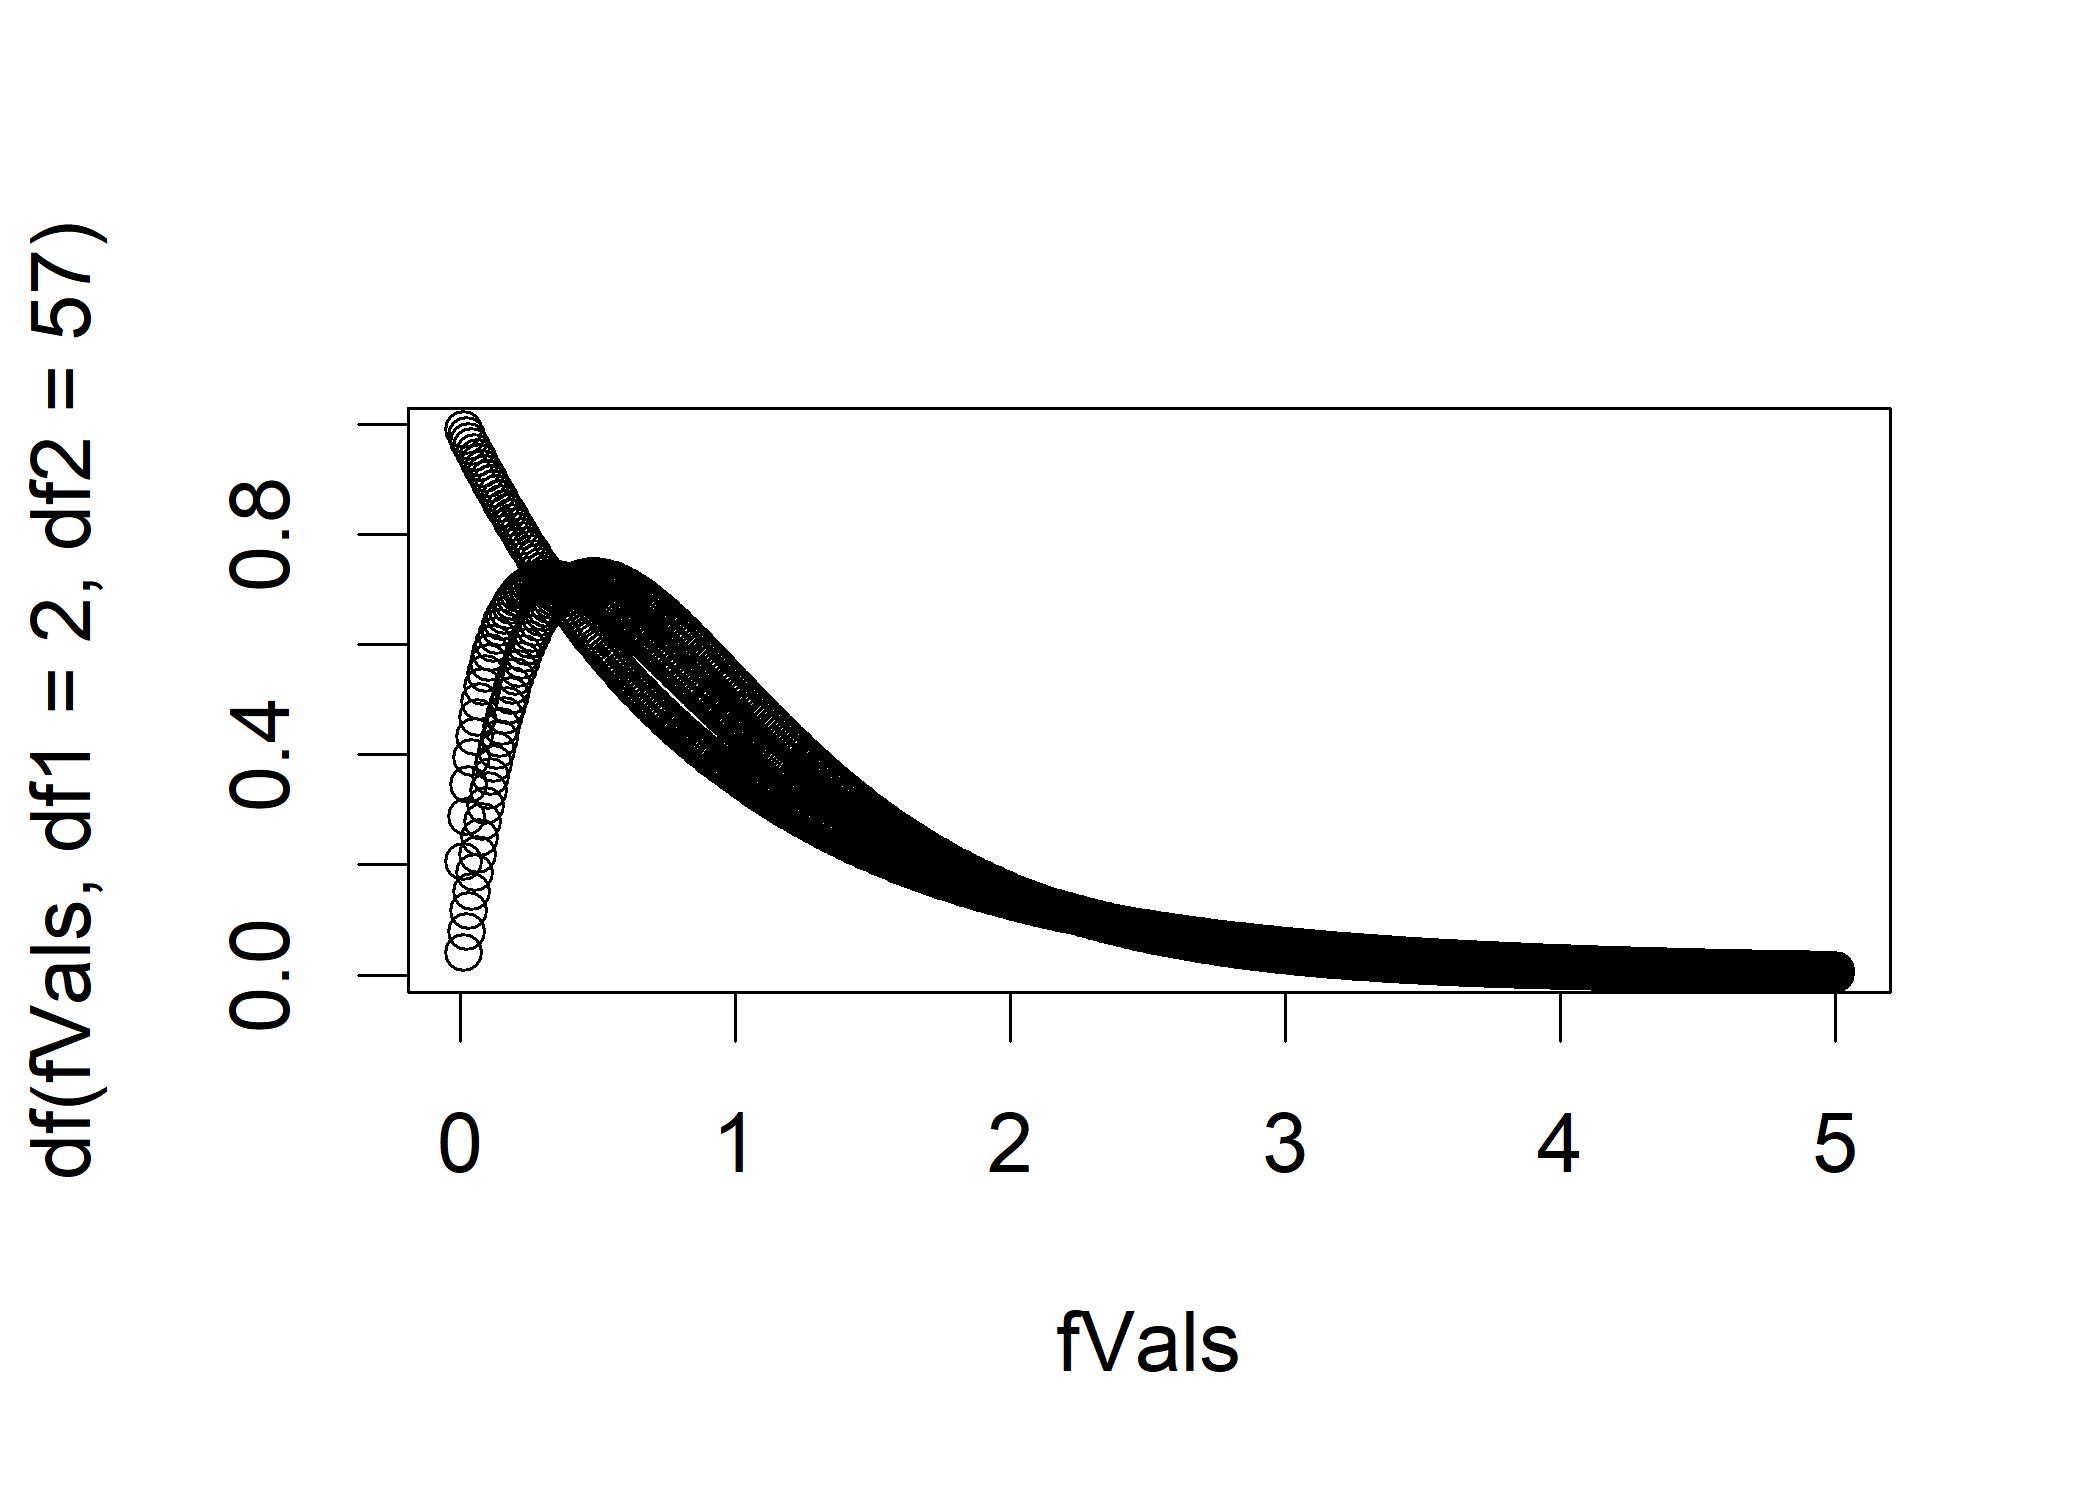 Each point on the density curve shows the percentage of F-values that would be seen at a specific level of F, if the null hypothesis were to hold.
| BASIS FOR COMPARISON | T TEST | F TEST |
|---|---|---|
| Meaning | T-test is a univariate hypothesis test, that is applied when standard deviation is not known and the sample size is small. | F-test is statistical test, that determines the equality of the variances of the two normal populations. |
| Test statistic | T-statistic follows Student t-distribution, under null hypothesis. | F-statistic follows Snedecor f-distribution, under null hypothesis. |
| Application | Comparing the means of two populations. | Comparing two population variances. |