10.4 Probabilities in Change-point Analysis
The cpt.mean() does not show the statistical significance test. We now check the probability/confidence level of the change point.
DAXcp <- cpt.mean(DAX,class=FALSE)
DAXcp["conf.value"]
## conf.value
##          1
The confidence value is 1.0, the strongest value, which means that the change in the mean of the time series is very significant.
Bayesian analysis output posterior priorities for mean changes at each point in the time series.
# install.packages("bcp")
library(bcp)
bcpDAX <- bcp(as.vector(DAX))
plot(bcpDAX)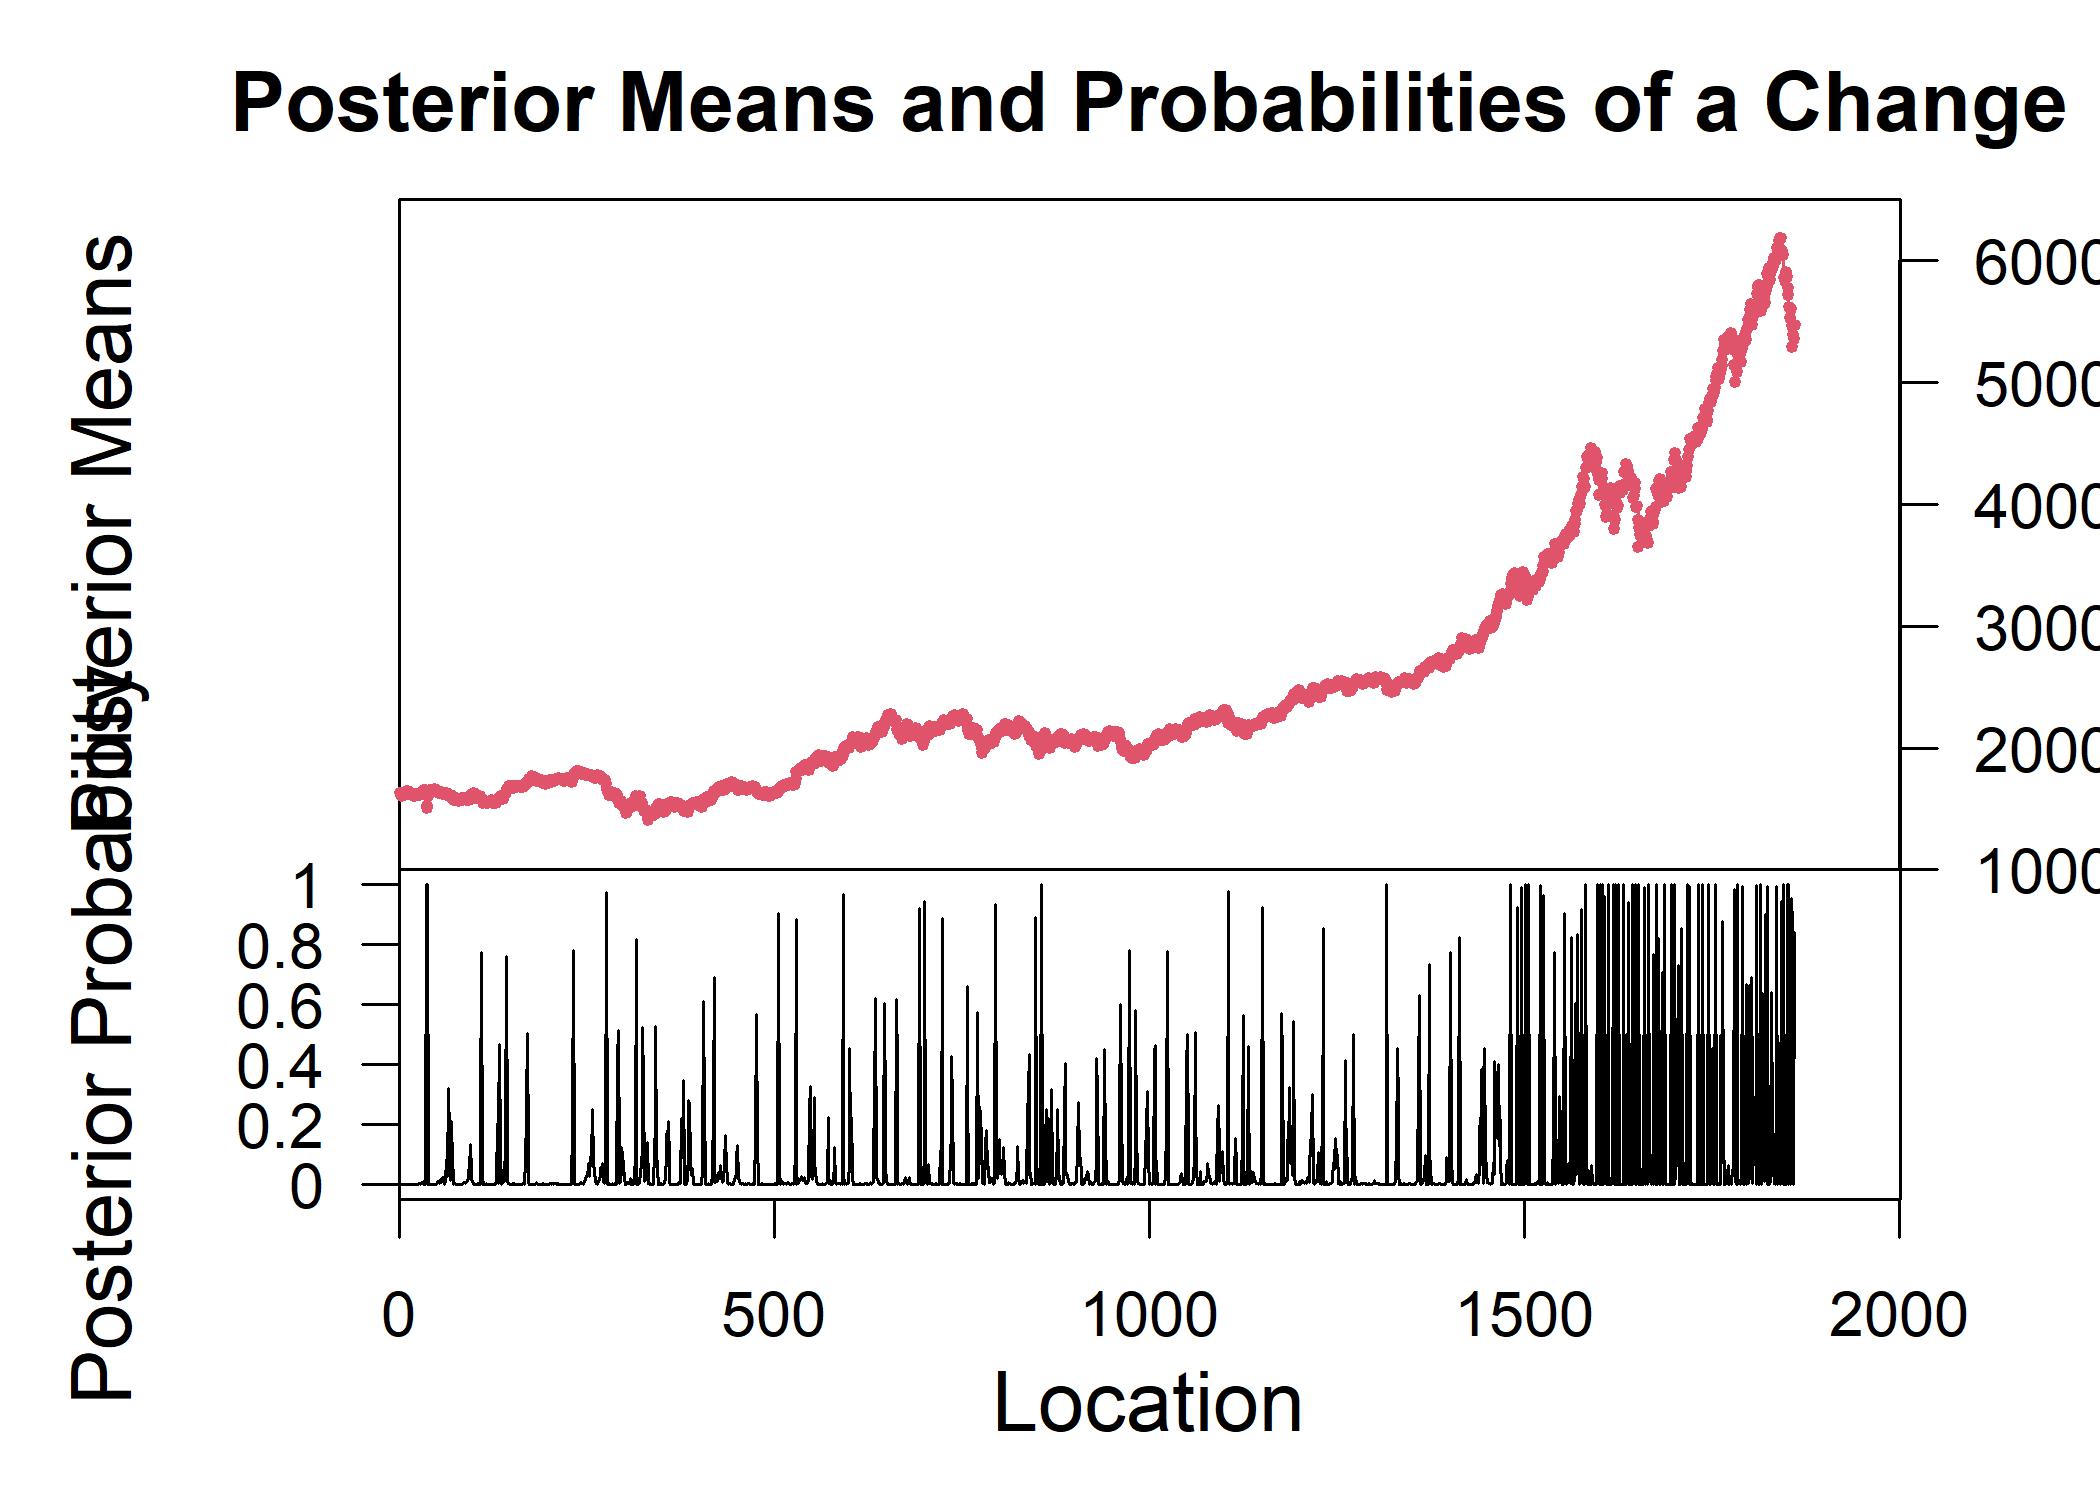 The upper pane shows the original time series and the lower pane shows the probabilities of a mean change at each point in time.
Somewhere near data point 1500 has a substantial density of probability values near 1.
The upper pane shows the original time series and the lower pane shows the probabilities of a mean change at each point in time.
Somewhere near data point 1500 has a substantial density of probability values near 1.
plot(bcpDAX$posterior.prob >.95) This plot separate the low and medium probability values from the high probability values.
There are two points above 500, two points above 1000, and a bunch of points above 1500, signifying that the probability of a change in the mean of the time series is very high at these points.
This plot separate the low and medium probability values from the high probability values.
There are two points above 500, two points above 1000, and a bunch of points above 1500, signifying that the probability of a change in the mean of the time series is very high at these points.